End-to-end observability for AI systems
Signals, spans and correlation for AI requests — and the honest limits of telemetry.
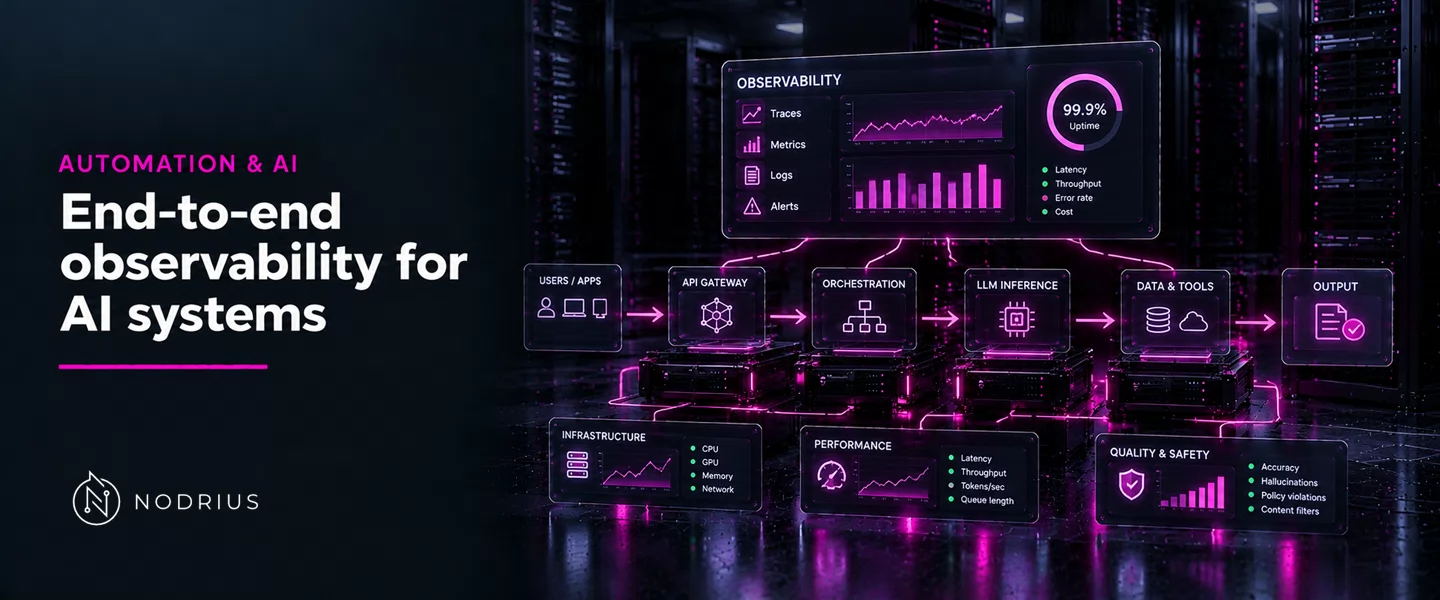
Observability is the ability to ask questions of a running system without already knowing how it is built. OpenTelemetry’s primer says it “lets you understand a system from the outside by letting you ask questions about that system without knowing its inner workings.” For an AI feature the questions are familiar — why so slow, why that cost, why this answer — but the answer comes from a request that crosses many components, one a model not fully determined by its input.
Three things make it observable: it emits a small set of signals; a trace correlates the pieces of one request across those components; and each piece records only what was instrumented, at the fidelity the sampling and content settings allowed. Telemetry shows a model call happened and how many tokens it used; not why the model answered as it did.
The signals an AI system emits
OpenTelemetry exists “to collect, process, and export signals”, defined as “system outputs that describe the underlying activity of the operating system and applications running on a platform.” The four signals are traces, metrics, logs and baggage; the AI case is the same signals, because one user turn fans out into an embedding call, a vector search, a model call and one or more tool calls, each a unit of work. The primer sets the aim: “An application is properly instrumented when developers don’t need to add more instrumentation to troubleshoot an issue, because they have all of the information they need.”
The trace is the correlation spine
A trace “records the path taken by a single request … as it propagates through multiple services in an architecture”, and “is made of one or more spans”. A span is “a single unit of work or operation”; the piece that travels between services is the span context, and OpenTelemetry calls Context Propagation “the core concept that enables Distributed Tracing.” That is the mechanism behind “end-to-end”: not one tool seeing everything, but every component’s span carrying the same trace ID. A span also carries a kind — client, server or internal — which “provides a hint to the tracing backend as to how the trace should be assembled”. On one AI request the gateway is a server span, the retrieval and model calls are client spans, and an in-process tool is an internal span; sharing one trace ID, they assemble into one waterfall.
What a GenAI span records — a specification draft
The OpenTelemetry GenAI semantic conventions define what such a span should carry, and are marked
Development — a specification draft, not a ratified standard. They name the operations a request
is broken into, including chat, embeddings, retrieval, execute_tool and invoke_agent. The
retrieval span, named {gen_ai.operation.name} {gen_ai.data_source.id}, can carry a
gen_ai.retrieval.documents attribute listing each document by id and relevance score — correlating an
answer back to its source document. The tool span, named execute_tool {gen_ai.tool.name}, carries a tool
call identifier, tying the model’s requested call to the code that ran it. A gen_ai.conversation.id,
“used to store and correlate messages within this conversation”, threads separate traces into one session.
Together these attributes tie a model call, a tool call and a retrieved document into one story.
Metrics, and the price of detail
Metrics are runtime measurements aggregated over time; metrics “provide statistical information in
aggregate”. The problem is cardinality, “the number of unique attribute combinations reported for it”:
because the SDK keeps separate aggregation state per combination, “cardinality drives the memory cost of
metrics”. The SDK enforces a limit — “The default is 2000” combinations — and folds anything beyond it into
one overflow data point marked otel.metric.overflow=true. A query that groups by an affected attribute then
undercounts, so an alert can quietly stop firing while the metric’s total still looks correct.
What to capture, and what telemetry cannot show
Model instructions, user messages and model outputs are, in the conventions’ words, “considered sensitive
and are often large in size”, so instrumentations “SHOULD NOT capture them by default, but SHOULD provide
an option for users to opt in” — on the span, or in separate storage with only a reference recorded. Three
limits follow. Telemetry reports only what was instrumented and sampled: a span status of Unset means
“the operation it tracked successfully completed without an error”. GenAI spans show “logical operations as
observed by the caller” — the caller’s view, not the provider’s internals. And correlation is a
relationship, not a proof of cause: NIST’s log-management guide defines event correlation as “finding
relationships between two or more log entries”. Instrumentation is also not accountability: replaying a
recorded trajectory belongs to a companion sheet, and the audit record of what an agent did to the L4
audit-trail sheet.
Level and prerequisites. L5 — advanced systems engineering: the reader must design instrumentation for a multi-component AI request and reason about the fidelity and blind spots of its telemetry. Prerequisites: the L1 sheets on how a model generates text and what its context window is; the L2 sheets on serving and structured output; the L3 sheets on retrieval and tool calling; and the L4 sheet on audit trails and logging of actions, which defines the record these signals feed.
Where to go next
- Automation & AI — the macro-area this sheet belongs to.
- Operations and risk — the node this sheet sits in.
References
- OpenTelemetry — Observability primer — the definition of observability, the “properly instrumented” standard, telemetry, spans and distributed traces.
- OpenTelemetry — Signals — the signal taxonomy: traces, metrics, logs, baggage and profiles.
- OpenTelemetry — Traces — the span model, span context, context propagation, span kind and span status.
- OpenTelemetry — Metrics — runtime measurement, the trace-versus-metrics distinction, and the cardinality limit and overflow behaviour.
- OpenTelemetry — Generative AI semantic conventions (specification draft) — operation names, the retrieval and tool spans, conversation correlation, and the content-capture guidance.
- NIST — Guide to Computer Security Log Management (SP 800-92) — event correlation as a relationship between log entries.